
Condition monitoring using the drive as a sensor

Variable speed drives can be a valuable source of data that can be used for condition monitoring, saving unnecessary expense.
Variable speed drives have been used for over half a century, with the main advantage being the reduction of electrical energy use. With the advance of Industry 4.0 the role of the drive moves from that of a pure power processor to that of an intelligent element of the automation system. The ability of the drive to act as a smart sensor makes it a natural choice when implementing condition monitoring. In this article we present how this can be used in water and wastewater applications.
New drive capabilities for water and wastewater applications
Today more than 20% of all electric motors are driven by variable speed drives. The main reason for using drives is the reduction of energy use; however, there are also other reasons for employing drives in water and wastewater applications, such as process control (keeping constant water pressure, thus avoiding leakage caused by high pressure), avoiding water hammer or optimised well exploitation.
Since the introduction of microprocessors to control the drives, additional functionality has been added to the original function — which is that of a power processor. For example, drives are able to perform pump de-ragging in wastewater applications, they are able to control several pumps in a cascade system in water pumping applications or they can bypass certain frequencies to avoid resonances.
The advance of Industry 4.0 has given an additional boost to these additional functions. As Industry 4.0 deals with information and networking, we can start using the drives as smart and networked sensors.

Industry 4.0 in motor and drive systems
Industry 4.0 is a generic term, suggesting a fourth industrial revolution which can be characterised by networking. Although the term is somewhat vague, a possible definition could be “Industry 4.0 describes the intelligent networking of people, things and systems by utilising all the possibilities of digitalisation across the entire value chain”.
The impact of this trend on motor systems is a migration from what is known as the ‘automation pyramid’ to networked systems (Figure 1). This means that the various elements of the system, such as motors, drives, sensors and controls, get interconnected and also connected to a cloud — where data is stored, processed and analysed, and where decisions are made.
The drive as a sensor
In variable speed drive applications, the availability of microprocessors in the drive and bus communication options, combined with current and voltage sensors, opens new opportunities. Additional sensors (such as vibration and pressure sensors) can also be connected to the drive at almost no cost. This allows the drive to be used as a smart sensor for condition monitoring (Figure 2). The available information offers various use cases, such as system optimisation, energy efficiency optimisation and condition-based maintenance.

Embedded condition-based monitoring
Condition monitoring is a technique to monitor the health of equipment in service. For this purpose, key parameters need to be selected as indicators for developing faults. The equipment condition typically degrades over time. Figure 3 shows a typical degradation pattern, also known as a PF-curve. The point of functional failure is when the equipment fails to provide the intended function. The idea of condition-based maintenance is to detect the potential failure before the actual failure occurs. In this case, maintenance actions can be planned before functional failure, with advantages such as: reduction of downtime, elimination of unexpected production stops, maintenance optimisation, reduction of spare parts stock and others.
Vibration level monitoring
Many mechanical failures, such as bearing wear-out, shaft misalignment and unbalances, create some kind of vibration. As a result, vibration monitoring has been established as the state-of-the-art for monitoring rotating machines. There are various methods of vibration monitoring ranging from basic simple monitoring up to highly sophisticated monitoring1.

A widely used method is vibration velocity RMS monitoring, which is based on the RMS value of the vibration signal that is measured through a vibration sensor. Many mechanical faults have a significant impact on the RMS of the vibration, such as unbalances, shaft misalignment and looseness. However, the challenge in variable speed applications is the dependency of the vibration on the actual speed. Mechanical resonances are typical examples: these are always present, and a monitoring system has to cope with them in some way. Often the fault detection levels are being set for worst case to avoid false alarms. This reduces the detection accuracy in speed regions where no resonances are present.
Having a suitable vibration transmitter mounted and connected to the drive, the drive can offer advanced monitoring by correlating the transmitter signal with internal drive signals, such as speed, or other signals that are relevant for the application. The drive can detect faults early and give traffic light info (Figure 3) on the health of the system to prevent functional failure. Maintenance can be prepared and scheduled in advance while the system can continue operation until the next possible maintenance break.
The vibration level in normal operation and in the presence of faults condition is also dependent on the type, location and mounting of the sensor. It also varies with the actual application that is to be monitored, so a learning period is required.
Learning can be achieved in different ways. The first approach is learning the normal vibration levels during the initial period of operation. This means the application is running normally and the drive learns the normal vibration in parallel without affecting the operation. When enough data has been collected, the drive starts to monitor the vibration for variation.
In the second approach, the drive can execute an identification run. Here, the drive controls the motor in a way that enough data is being collected. The possibility of using this second approach depends on the specific application. For example, in a water supply system the pump may not be allowed to run at full speed at the time of commissioning.
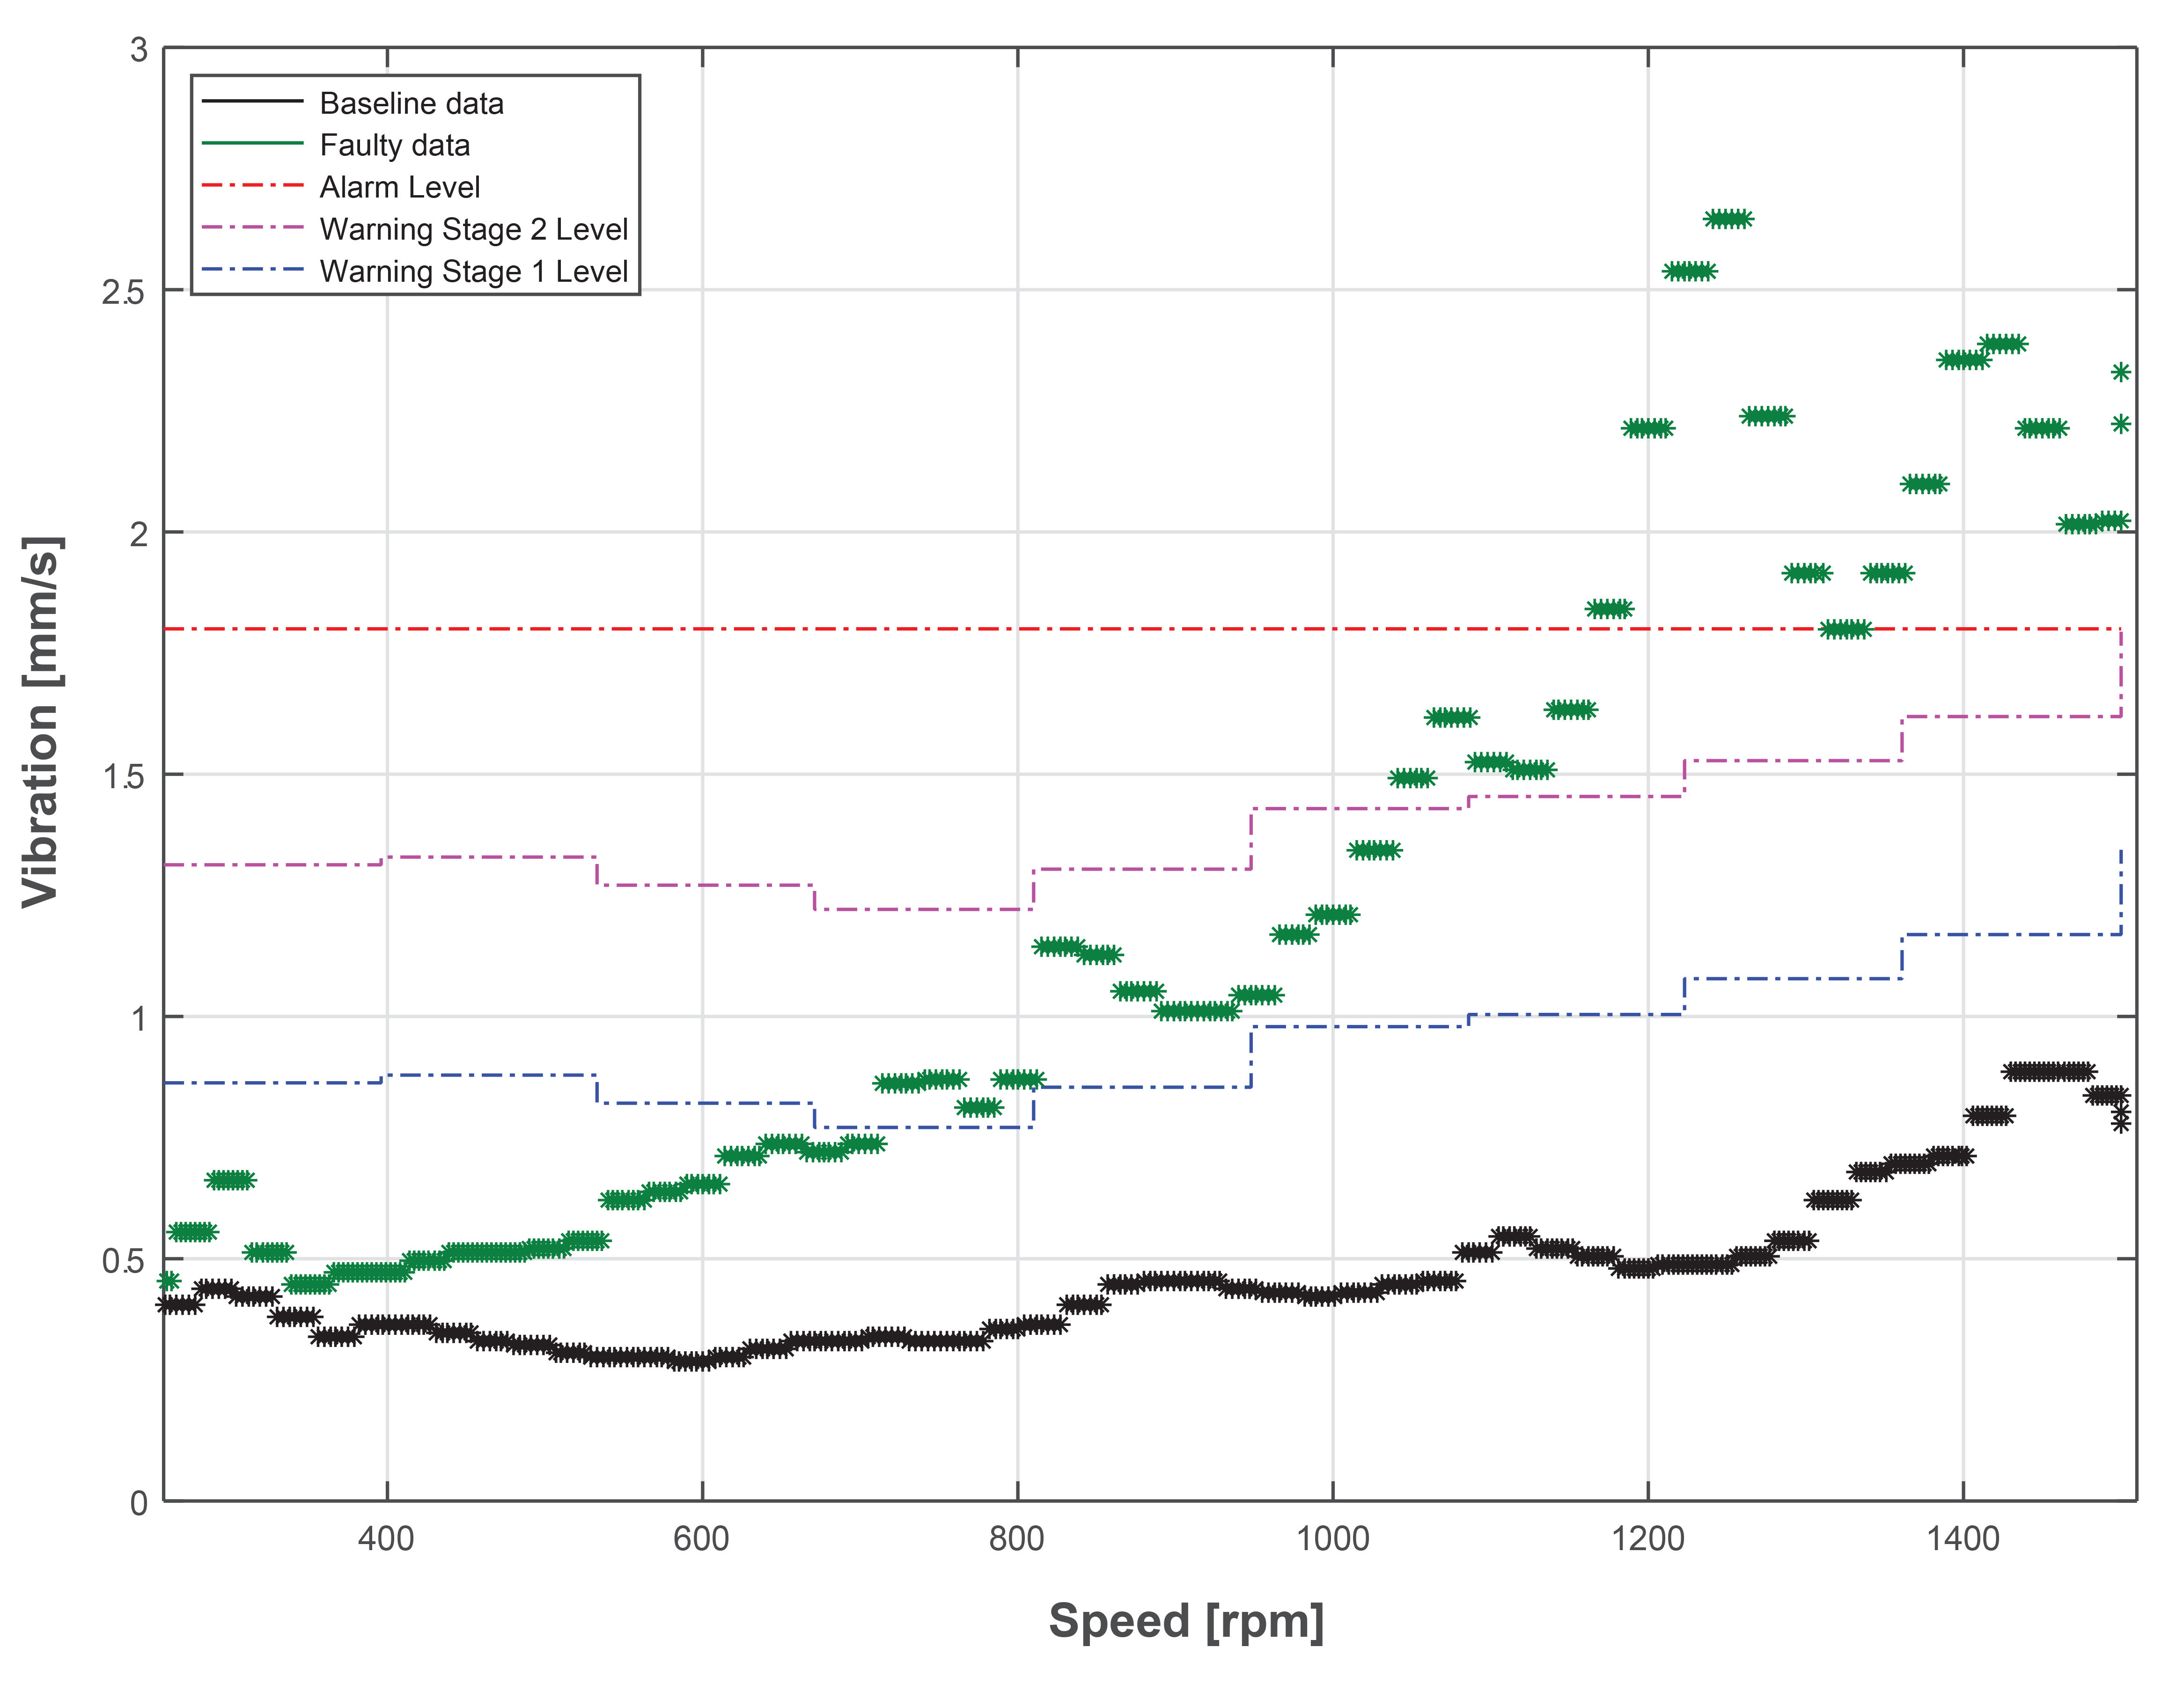
Figure 4 shows an example of the results of testing a shaft misalignment. The measured vibration in mm/s versus the motor speed in RMS is shown for two scenarios. In the first scenario the system is in its healthy state. In this state, a baseline measurement is executed. The warning and alarm thresholds are derived based on the measured baseline. For the faulty scenario, a shaft misalignment is created by slightly lifting the motor baseplate. The measured vibration in faulty condition is shown in green.

In this example, the drive can clearly detect this fault. For other applications, the baseline data can be very different. Typically, even in a healthy state the vibration is dependent on speed. There can even by resonance points that need to be taken into account while monitoring. Other types of faults, such as unbalances and looseness, create different patterns.
Electrical signature analysis
The condition of the motor and application can also be monitored through electrical signature analysis. This technique has been under research for many years. The early studies addressed direct online machines, and later variable speed drive applications2,3,4. With the available processing power and memory in today’s drives, these techniques can now be integrated into drives as features.
In this concept, fault condition indicators can be extracted from the motor currents and voltage signals. Frequency components of currents and voltages can be related to motor or application faults, such as shaft misalignment or stator winding faults. The current and voltage sensors are essential components of drives anyway, as they provide the necessary signals for controlling the motor. These signals can therefore also be used for monitoring purposes. Thus, no extra sensor costs are added. Signal processing and analytic techniques play an important role in this context.
The drive, being the controller of the motor, can correlate the monitored values, like the specific current harmonics, with other available information inside the drive. Knowing the controller state for instance, the drive knows when meaningful spectrum calculations can be performed. Similar to vibration level monitoring, the correlation of monitored values with motor speed, load and other relevant process data (eg, pressure in water pipes) can be performed to get more accurate fault information.
Load monitoring in pumps
As shown in the previous section, drives are measuring motor current and voltage and the primary purpose is to use these measurements for controlling the motor. The primary current and voltage measurement is used to calculate various parameters such as motor power, energy, actual motor speed or torque. And these values can be used for monitoring the motor load, eg, a pump.

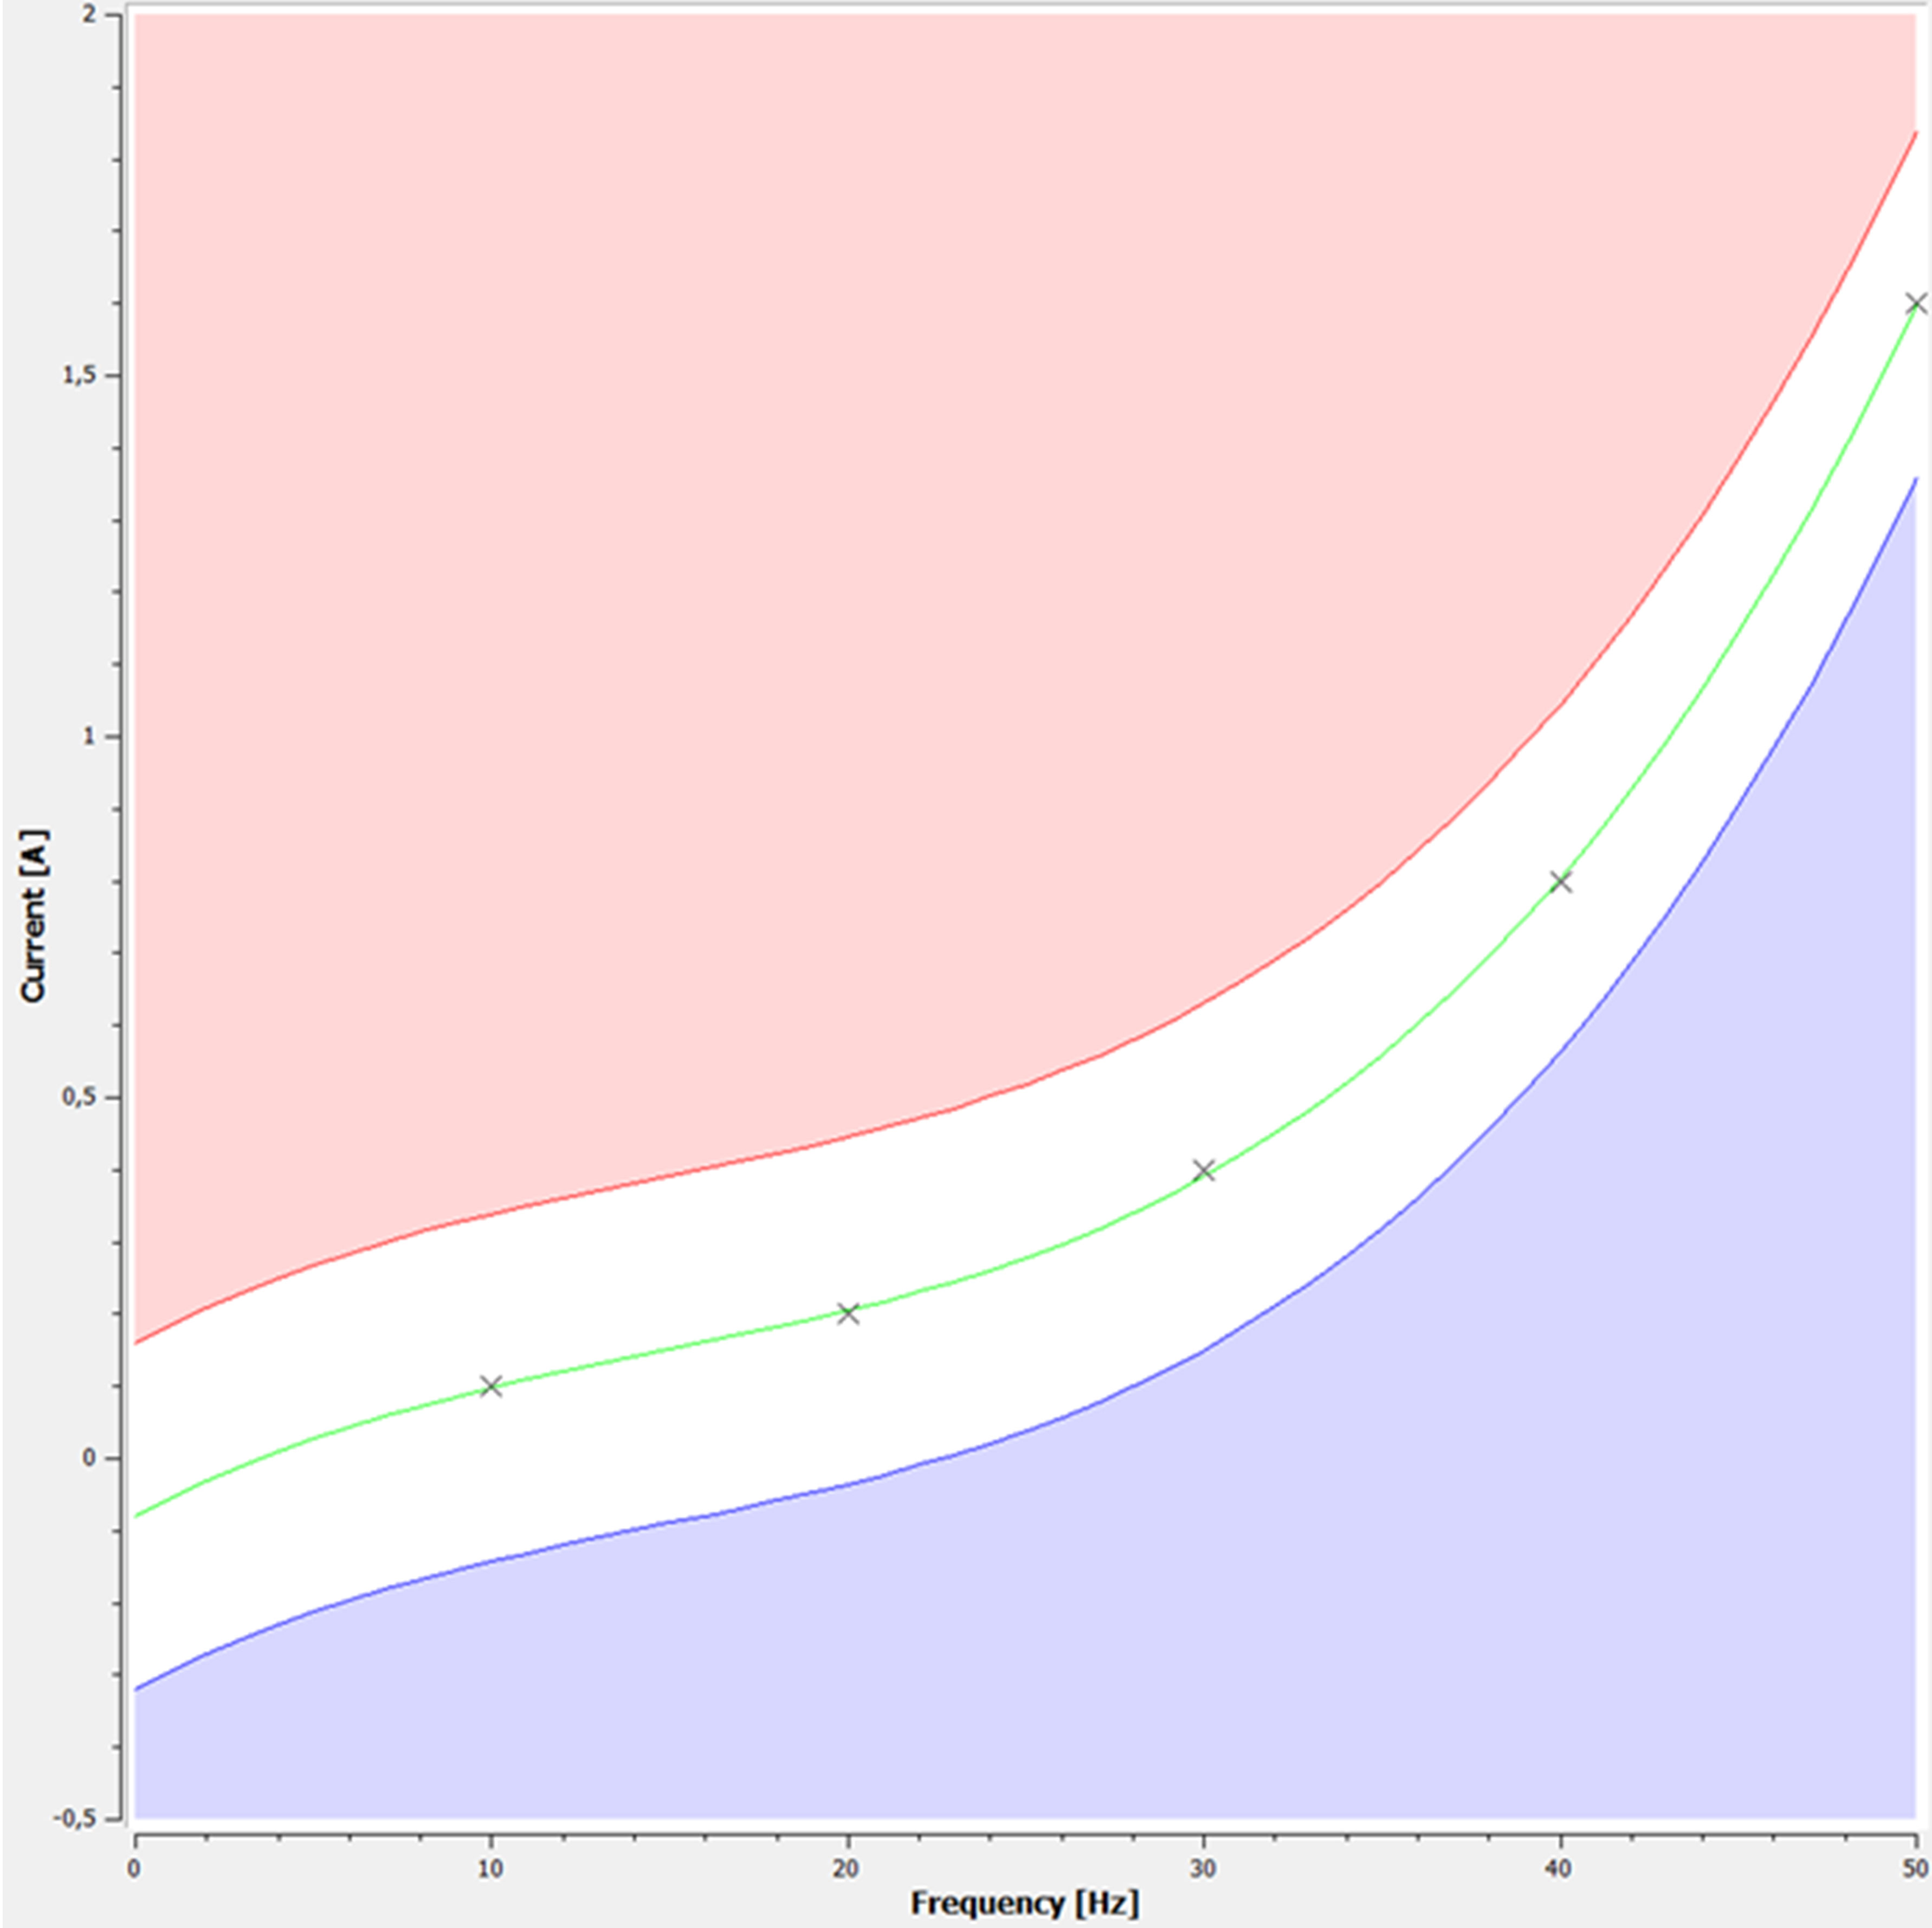
In applications where the load depends on the motor speed, the torque estimation can be used for determining overload and under-load deviations. During baseline the drive ‘learns’ the normal distribution of the load, or the load envelope, as shown in Figure 5. As in the previous functions, there is a correlation with the motor speed. During monitoring, the drive can detect overload and under-load conditions, which can be caused in pump applications by faults such as fouling, sanding, broken impellers or pump wear.
Conclusions
Condition monitoring can be used for implementing condition-based maintenance — which is an evolution from corrective and preventive maintenance. But condition monitoring relies on sensor data; and installing additional sensors can be expensive. However, if variable speed drives are already used in the application, they are a valuable source of data that can be used for condition monitoring, saving unnecessary expense.
References
- Randall RB 2011, Vibration-based Condition Monitoring: Industrial, Aerospace and Automotive Applications, Wiley
- Toliyat HA, Nandi S, Choi S, Meshgin-Kelk H 2017, Electric Machines: Modeling, Condition Monitoring, and Fault Diagnosis, CRC Press.
- Penrose HP 2008, Electrical Motor Diagnostics, 2nd Edition, Success By Design.
- Dwivedi SK, Dannehl J 2017, “Modeling and simulation of stator and rotor faults of induction motor and their experimental comparison”, IEEE 11th International Symposium on Diagnostics for Electrical Machines, Power Electronics and Drives (SDEMPED), IEEE.
Microgrids: moving towards climate change resilience
The benefits of microgrids go far beyond support during a natural disaster and can provide...
Good for today, ready for tomorrow: how the DCS is adapting to meet changing needs
The future DCS will be modular and offer a more digital experience with another level of...
Software-based process orchestration improves visibility at hydrogen facility
Toyota Australia implemented software-based process orchestration from Emerson at its Altona...


